


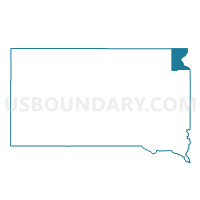
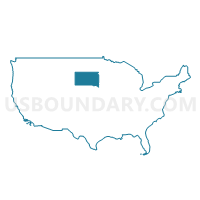
Roberts County, South Dakota
About
Outline

Summary
| Unique Area Identifier | 121525 |
| Name | Roberts County |
| State | South Dakota |
| Area (square miles) | 1,135.77 |
| Land Area (square miles) | 1,101.04 |
| Water Area (square miles) | 34.73 |
| % of Land Area | 96.94 |
| % of Water Area | 3.06 |
| Latitude of the Internal Point | 45.62339730 |
| Longtitude of the Internal Point | -96.94755130 |
| Total Population | 10,149 |
| Total Housing Units | 4,905 |
| Total Households | 3,823 |
| Median Age | 39.5 |
Maps
Graphs
Select a template below for downloading or customizing gragh for Roberts County, South Dakota


Neighbors
Neighoring County (by Name) Neighboring County on the Map
- Big Stone County, MN
- Day County, SD
- Grant County, SD
- Marshall County, SD
- Richland County, ND
- Sargent County, ND
- Traverse County, MN
County Subdivision in Roberts County (by Name) Neighboring County Subdivision on the Map
- Agency township, Roberts County, SD
- Alto township, Roberts County, SD
- Becker township, Roberts County, SD
- Bossko township, Roberts County, SD
- Bryant township, Roberts County, SD
- Claire City town, Roberts County, SD
- Corona town, Roberts County, SD
- Dry Wood Lake township, Roberts County, SD
- Easter township, Roberts County, SD
- Enterprise township, Roberts County, SD
- Garfield township, Roberts County, SD
- Geneseo township, Roberts County, SD
- Goodwill township, Roberts County, SD
- Grant township, Roberts County, SD
- Harmon township, Roberts County, SD
- Hart township, Roberts County, SD
- Lake township, Roberts County, SD
- Lawrence township, Roberts County, SD
- Lee township, Roberts County, SD
- Lien township, Roberts County, SD
- Lockwood township, Roberts County, SD
- Long Hollow township, Roberts County, SD
- Minnesota township, Roberts County, SD
- New Effington town, Roberts County, SD
- Norway township, Roberts County, SD
- One Road township, Roberts County, SD
- Ortley town, Roberts County, SD
- Ortley township, Roberts County, SD
- Peever town, Roberts County, SD
- Rosholt town, Roberts County, SD
- Sisseton city, Roberts County, SD
- Sisseton township, Roberts County, SD
- Spring Grove township, Roberts County, SD
- Springdale township, Roberts County, SD
- Summit town, Roberts County, SD
- Summit township, Roberts County, SD
- Victor township, Roberts County, SD
- White Rock town, Roberts County, SD
- White Rock township, Roberts County, SD
- Wilmot city, Roberts County, SD
Top 10 Neighboring Place (by Population) Neighboring Place on the Map
- Sisseton city, SD (2,470)
- Browns Valley city, MN (589)
- Goodwill CDP, SD (513)
- Wilmot city, SD (492)
- Rosholt town, SD (423)
- Summit town, SD (288)
- New Effington town, SD (256)
- Long Hollow CDP, SD (192)
- Agency Village CDP, SD (181)
- Peever town, SD (168)
Top 10 Neighboring Unified School District (by Population) Neighboring Unified School District on the Map
- Sisseton School District 54-2, SD (7,853)
- Milbank School District 25-4, SD (5,743)
- Ortonville -Bellingham Public School District, MN (3,549)
- Webster School District 18-4, SD (3,038)
- Clinton-Graceville-Beardsley Public School District, MN (2,587)
- Wheaton Area School Public School District, MN (2,186)
- Hankinson Public School District 8, ND (1,721)
- Wilmot School District 54-7, SD (1,540)
- Waubay School District 18-3, SD (1,359)
- Lidgerwood Public School District 28, ND (1,202)
Top 10 Neighboring State Legislative District Lower Chamber (by Population) Neighboring State Legislative District Lower Chamber on the Map
- State House District 9B, MN (39,347)
- State House District 20A, MN (32,187)
- State House District 4, SD (20,558)
- State House District 1, SD (20,515)
- State House District 25, ND (13,025)
- State House District 26, ND (12,887)
Top 10 Neighboring State Legislative District Upper Chamber (by Population) Neighboring State Legislative District Upper Chamber on the Map
- State Senate District 9, MN (81,765)
- State Senate District 20, MN (66,816)
- State Senate District 4, SD (20,558)
- State Senate District 1, SD (20,515)
- State Senate District 25, ND (13,025)
- State Senate District 26, ND (12,887)
Top 10 Neighboring 111th Congressional District (by Population) Neighboring 111th Congressional District on the Map
- Congressional District (at Large), SD (814,180)
- Congressional District (at Large), ND (672,591)
- Congressional District 7, MN (625,512)
Top 10 Census Tract in Roberts County (by Population) Neighboring Census Tract on the Map
- Census Tract 9408, Roberts County, SD (2,862)
- Census Tract 9404, Roberts County, SD (2,775)
- Census Tract 9407, Roberts County, SD (2,673)
- Census Tract 9504, Roberts County, SD (1,839)
Top 10 Neighboring 5-Digit ZIP Code Tabulation Area (by Population) Neighboring 5-Digit ZIP Code Tabulation Area on the Map
- 57262, SD (4,963)
- 57252, SD (4,800)
- 56278, MN (2,601)
- 56296, MN (2,029)
- 58041, ND (1,545)
- 57273, SD (1,316)
- 58053, ND (1,171)
- 57260, SD (1,093)
- 56219, SD (1,082)
- 57279, SD (1,058)
Data
Demographic, Population, Households, and Housing Units
** Data sources from census 2010 **
Show Data on Map
Download Full List as CSV
Download Quick Sheet as CSV
| Subject | This Area | South Dakota | National |
|---|---|---|---|
| POPULATION | |||
| Total Population Map | 10,149 | 814,180 | 308,745,538 |
| POPULATION, HISPANIC OR LATINO ORIGIN | |||
| Not Hispanic or Latino Map | 10,023 | 792,061 | 258,267,944 |
| Hispanic or Latino Map | 126 | 22,119 | 50,477,594 |
| POPULATION, RACE | |||
| White alone Map | 6,265 | 699,392 | 223,553,265 |
| Black or African American alone Map | 11 | 10,207 | 38,929,319 |
| American Indian and Alaska Native alone Map | 3,506 | 71,817 | 2,932,248 |
| Asian alone Map | 21 | 7,610 | 14,674,252 |
| Native Hawaiian and Other Pacific Islander alone Map | 0 | 394 | 540,013 |
| Some Other Race alone Map | 37 | 7,477 | 19,107,368 |
| Two or More Races Map | 309 | 17,283 | 9,009,073 |
| POPULATION, SEX | |||
| Male Map | 5,098 | 407,381 | 151,781,326 |
| Female Map | 5,051 | 406,799 | 156,964,212 |
| POPULATION, AGE (18 YEARS) | |||
| 18 years and over Map | 7,269 | 611,383 | 234,564,071 |
| Under 18 years | 2,880 | 202,797 | 74,181,467 |
| POPULATION, AGE | |||
| Under 5 years | 828 | 59,621 | 20,201,362 |
| 5 to 9 years | 758 | 55,531 | 20,348,657 |
| 10 to 14 years | 764 | 53,960 | 20,677,194 |
| 15 to 17 years | 530 | 33,685 | 12,954,254 |
| 18 and 19 years | 249 | 23,943 | 9,086,089 |
| 20 years | 107 | 11,907 | 4,519,129 |
| 21 years | 92 | 11,739 | 4,354,294 |
| 22 to 24 years | 302 | 33,950 | 12,712,576 |
| 25 to 29 years | 490 | 55,570 | 21,101,849 |
| 30 to 34 years | 509 | 49,859 | 19,962,099 |
| 35 to 39 years | 500 | 45,766 | 20,179,642 |
| 40 to 44 years | 594 | 47,346 | 20,890,964 |
| 45 to 49 years | 670 | 57,519 | 22,708,591 |
| 50 to 54 years | 683 | 59,399 | 22,298,125 |
| 55 to 59 years | 706 | 54,231 | 19,664,805 |
| 60 and 61 years | 229 | 18,999 | 7,113,727 |
| 62 to 64 years | 380 | 24,574 | 9,704,197 |
| 65 and 66 years | 218 | 13,621 | 5,319,902 |
| 67 to 69 years | 271 | 18,323 | 7,115,361 |
| 70 to 74 years | 406 | 25,683 | 9,278,166 |
| 75 to 79 years | 345 | 21,724 | 7,317,795 |
| 80 to 84 years | 243 | 18,004 | 5,743,327 |
| 85 years and over | 275 | 19,226 | 5,493,433 |
| MEDIAN AGE BY SEX | |||
| Both sexes Map | 39.50 | 36.90 | 37.20 |
| Male Map | 38.90 | 35.60 | 35.80 |
| Female Map | 40.20 | 38.20 | 38.50 |
| HOUSEHOLDS | |||
| Total Households Map | 3,823 | 322,282 | 116,716,292 |
| HOUSEHOLDS, HOUSEHOLD TYPE | |||
| Family households: Map | 2,655 | 206,964 | 77,538,296 |
| Husband-wife family Map | 1,878 | 161,617 | 56,510,377 |
| Other family: Map | 777 | 45,347 | 21,027,919 |
| Male householder, no wife present Map | 263 | 14,233 | 5,777,570 |
| Female householder, no husband present Map | 514 | 31,114 | 15,250,349 |
| Nonfamily households: Map | 1,168 | 115,318 | 39,177,996 |
| Householder living alone Map | 1,045 | 94,638 | 31,204,909 |
| Householder not living alone Map | 123 | 20,680 | 7,973,087 |
| HOUSEHOLDS, HISPANIC OR LATINO ORIGIN OF HOUSEHOLDER | |||
| Not Hispanic or Latino householder: Map | 3,797 | 316,719 | 103,254,926 |
| Hispanic or Latino householder: Map | 26 | 5,563 | 13,461,366 |
| HOUSEHOLDS, RACE OF HOUSEHOLDER | |||
| Householder who is White alone | 2,742 | 292,219 | 89,754,352 |
| Householder who is Black or African American alone | 4 | 3,029 | 14,129,983 |
| Householder who is American Indian and Alaska Native alone | 999 | 18,966 | 939,707 |
| Householder who is Asian alone | 6 | 2,199 | 4,632,164 |
| Householder who is Native Hawaiian and Other Pacific Islander alone | 0 | 111 | 143,932 |
| Householder who is Some Other Race alone | 9 | 2,014 | 4,916,427 |
| Householder who is Two or More Races | 63 | 3,744 | 2,199,727 |
| HOUSEHOLDS, HOUSEHOLD TYPE BY HOUSEHOLD SIZE | |||
| Family households: Map | 2,655 | 206,964 | 77,538,296 |
| 2-person household Map | 1,252 | 99,234 | 31,882,616 |
| 3-person household Map | 489 | 41,815 | 17,765,829 |
| 4-person household Map | 408 | 36,252 | 15,214,075 |
| 5-person household Map | 274 | 18,345 | 7,411,997 |
| 6-person household Map | 134 | 6,918 | 3,026,278 |
| 7-or-more-person household Map | 98 | 4,400 | 2,237,501 |
| Nonfamily households: Map | 1,168 | 115,318 | 39,177,996 |
| 1-person household Map | 1,045 | 94,638 | 31,204,909 |
| 2-person household Map | 100 | 16,441 | 6,360,012 |
| 3-person household Map | 15 | 2,758 | 992,156 |
| 4-person household Map | 6 | 1,019 | 411,171 |
| 5-person household Map | 2 | 303 | 126,634 |
| 6-person household Map | 0 | 95 | 48,421 |
| 7-or-more-person household Map | 0 | 64 | 34,693 |
| HOUSING UNITS | |||
| Total Housing Units Map | 4,905 | 363,438 | 131,704,730 |
| HOUSING UNITS, OCCUPANCY STATUS | |||
| Occupied Map | 3,823 | 322,282 | 116,716,292 |
| Vacant Map | 1,082 | 41,156 | 14,988,438 |
| HOUSING UNITS, OCCUPIED, TENURE | |||
| Owned with a mortgage or a loan Map | 1,175 | 133,814 | 52,979,430 |
| Owned free and clear Map | 1,457 | 85,744 | 23,006,644 |
| Renter occupied Map | 1,191 | 102,724 | 40,730,218 |
| HOUSING UNITS, VACANT, VACANCY STATUS | |||
| For rent Map | 127 | 10,366 | 4,137,567 |
| Rented, not occupied Map | 6 | 642 | 206,825 |
| For sale only Map | 34 | 3,696 | 1,896,796 |
| Sold, not occupied Map | 22 | 1,314 | 421,032 |
| For seasonal, recreational, or occasional use Map | 647 | 13,277 | 4,649,298 |
| For migrant workers Map | 0 | 88 | 24,161 |
| Other vacant Map | 246 | 11,773 | 3,652,759 |
| HOUSING UNITS, OCCUPIED, AVERAGE HOUSEHOLD SIZE BY TENURE | |||
| Total: Map | 2.58 | 2.42 | 2.58 |
| Owner occupied Map | 2.55 | 2.53 | 2.65 |
| Renter occupied Map | 2.65 | 2.18 | 2.44 |
| HOUSING UNITS, OCCUPIED, TENURE BY RACE OF HOUSEHOLDER | |||
| Owner occupied: Map | 2,632 | 219,558 | 75,986,074 |
| Householder who is White alone Map | 2,174 | 208,007 | 63,446,275 |
| Householder who is Black or African American alone Map | 3 | 747 | 6,261,464 |
| Householder who is American Indian and Alaska Native alone Map | 420 | 7,391 | 509,588 |
| Householder who is Asian alone Map | 2 | 958 | 2,688,861 |
| Householder who is Native Hawaiian and Other Pacific Islander alone Map | 0 | 50 | 61,911 |
| Householder who is Some Other Race alone Map | 5 | 753 | 1,975,817 |
| Householder who is Two or More Races Map | 28 | 1,652 | 1,042,158 |
| Renter occupied: Map | 1,191 | 102,724 | 40,730,218 |
| Householder who is White alone Map | 568 | 84,212 | 26,308,077 |
| Householder who is Black or African American alone Map | 1 | 2,282 | 7,868,519 |
| Householder who is American Indian and Alaska Native alone Map | 579 | 11,575 | 430,119 |
| Householder who is Asian alone Map | 4 | 1,241 | 1,943,303 |
| Householder who is Native Hawaiian and Other Pacific Islander alone Map | 0 | 61 | 82,021 |
| Householder who is Some Other Race alone Map | 4 | 1,261 | 2,940,610 |
| Householder who is Two or More Races Map | 35 | 2,092 | 1,157,569 |
| HOUSING UNITS, OCCUPIED, TENURE BY HISPANIC OR LATINO ORIGIN OF HOUSEHOLDER | |||
| Owner occupied: Map | 2,632 | 219,558 | 75,986,074 |
| Not Hispanic or Latino householder Map | 2,623 | 217,277 | 69,617,625 |
| Hispanic or Latino householder Map | 9 | 2,281 | 6,368,449 |
| Renter occupied: Map | 1,191 | 102,724 | 40,730,218 |
| Not Hispanic or Latino householder Map | 1,174 | 99,442 | 33,637,301 |
| Hispanic or Latino householder Map | 17 | 3,282 | 7,092,917 |
| HOUSING UNITS, OCCUPIED, TENURE BY HOUSEHOLD SIZE | |||
| Owner occupied: Map | 2,632 | 219,558 | 75,986,074 |
| 1-person household Map | 603 | 48,035 | 16,453,569 |
| 2-person household Map | 1,110 | 89,722 | 27,618,605 |
| 3-person household Map | 338 | 31,852 | 12,517,563 |
| 4-person household Map | 275 | 28,667 | 10,998,793 |
| 5-person household Map | 171 | 13,866 | 5,057,765 |
| 6-person household Map | 79 | 4,880 | 1,965,796 |
| 7-or-more-person household Map | 56 | 2,536 | 1,373,983 |
| Renter occupied: Map | 1,191 | 102,724 | 40,730,218 |
| 1-person household Map | 442 | 46,603 | 14,751,340 |
| 2-person household Map | 242 | 25,953 | 10,624,023 |
| 3-person household Map | 166 | 12,721 | 6,240,422 |
| 4-person household Map | 139 | 8,604 | 4,626,453 |
| 5-person household Map | 105 | 4,782 | 2,480,866 |
| 6-person household Map | 55 | 2,133 | 1,108,903 |
| 7-or-more-person household Map | 42 | 1,928 | 898,211 |
Loading...